Generating and exporting reports (Reports)
The original draft described three separate report pages: Customer Traffic, Customer Presence, Check Meeting. On the live Portal (2026-07-21), Reports → Report is a single, unified report-generation form, parameterized by an Event Type choice — not 3 separate pages. The content below describes the real form as observed; a full report run wasn't completed (the actual output/CSV columns weren't seen), so the results section still relies partly on the original draft and needs further verification.
The Reports section on the Portal has 3 sub-pages:
- Report — the camera analytics report builder (the main subject of this doc).
- Execution Report — see Execution Report below.
- Usage Reporting — see Usage Reporting below.
Prerequisites
- At least one Task AI is running and has data — see Configuring Task AI.
Generating a report (Report)
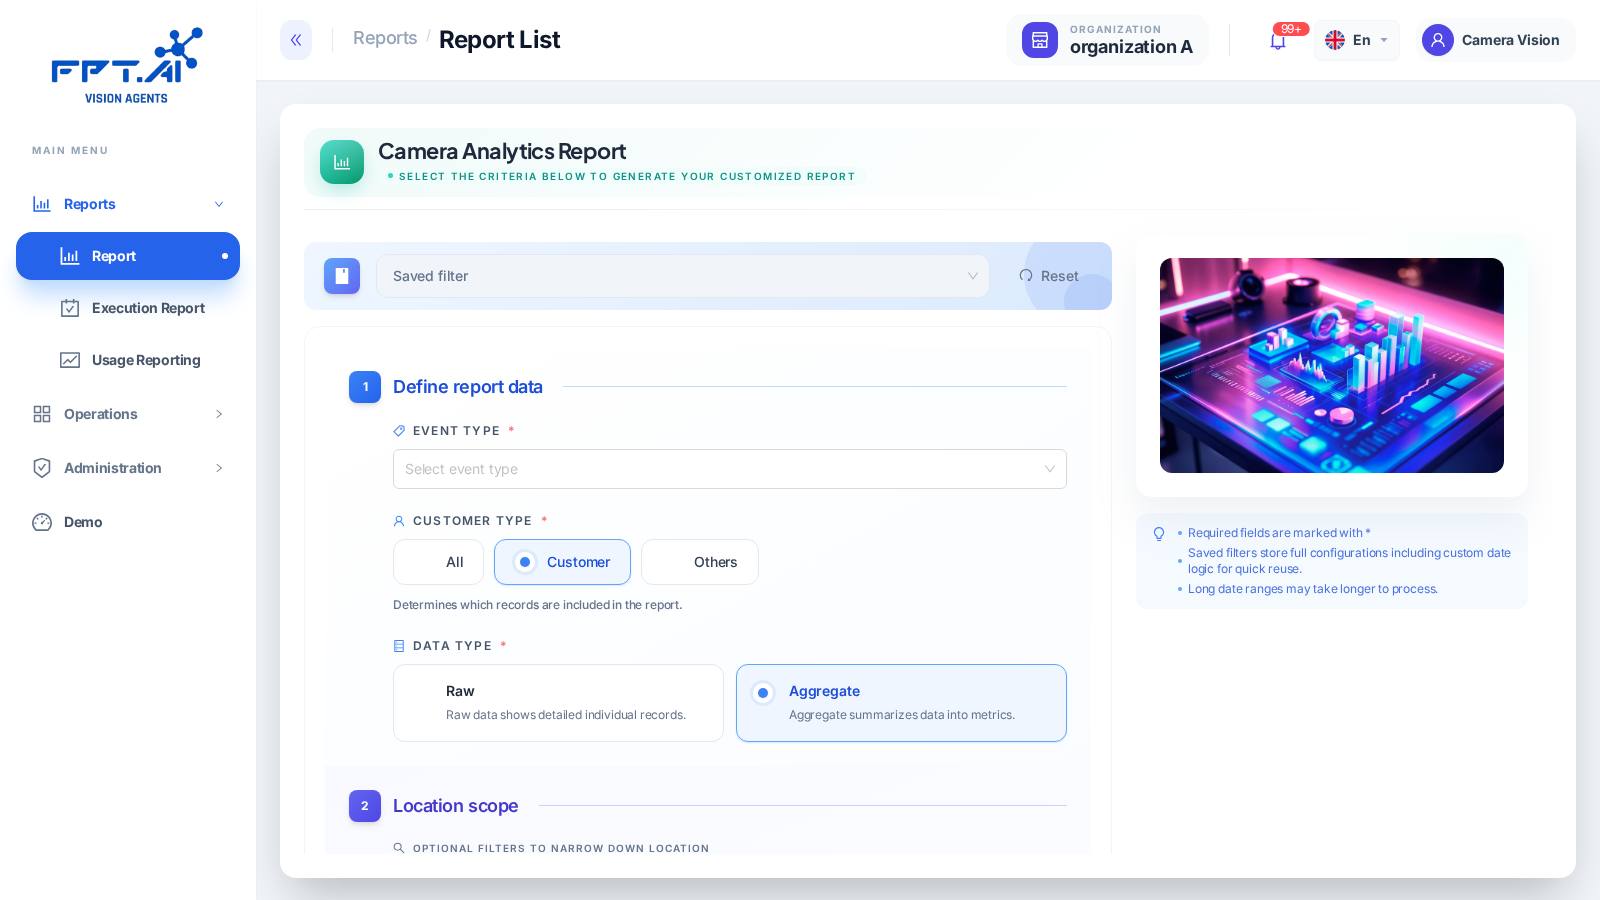
Go to Reports → Report. The form has 3 steps:
1. Define report data
| Field | Required | Description |
|---|---|---|
| Event Type | Yes | The event type to report on. Confirmed directly (2026-07-21): 5 values, matching the task Detection Event list — Đếm người (People Counting), People Tracking, Restricted Area Alert, Đếm người body (People Counting – body detection variant), Check họp đầu ca (Shift Meeting Check) (see Configuring Task AI) |
| Customer Type | Yes | All / Customer / Others — filters by customer classification |
| Data Type | Yes | Raw (per-record detail) or Aggregate (summarized metrics) |
2. Location scope
Optional filters to narrow down the location scope:
| Field | Description |
|---|---|
| Region | Filter by region (default: All Regions) |
| Area | Filter by area (default: All Areas) |
| Brand | Filter by brand (default: All Brands) |
| Location | Choose a specific location (required) |
3. Time range
| Field | Description |
|---|---|
| Quick range | Today / Last 7 days / Last 30 days |
| From / To | Choose a custom date range |
If you choose Last 7 days/Last 30 days, the date range automatically updates each time you run the report (it isn't fixed to the dates first selected).
Once filled in, click Save filter (to reuse it later) or Generate to produce the report.
Exporting a report as CSV
(The CSV export step wasn't directly confirmed during this testing round — the description below is unchanged from the original draft and needs re-verification.)
- Configure the report filters as above.
- Click Export CSV.
- The CSV file downloads automatically.
Usage notes
All times in reports are shown in Vietnam time (Asia/Ho_Chi_Minh, UTC+7). The underlying database stores times in UTC. (not re-verified during this round)
The system processes video in batches — video is uploaded to storage and only analyzed afterward. If you view a report the same day, some of that day's video may not be fully processed yet, so the numbers may be incomplete. Numbers stabilize once all of that day's video has been analyzed (usually the next day). (not re-verified during this round, but consistent with the "Media Upload Status" column observed on the camera page — see Managing cameras)
Execution Report
The Task Execution Report page shows a list of task executions by day and shift, with a data reliability metric — useful for spotting which shifts have missing recorded data.
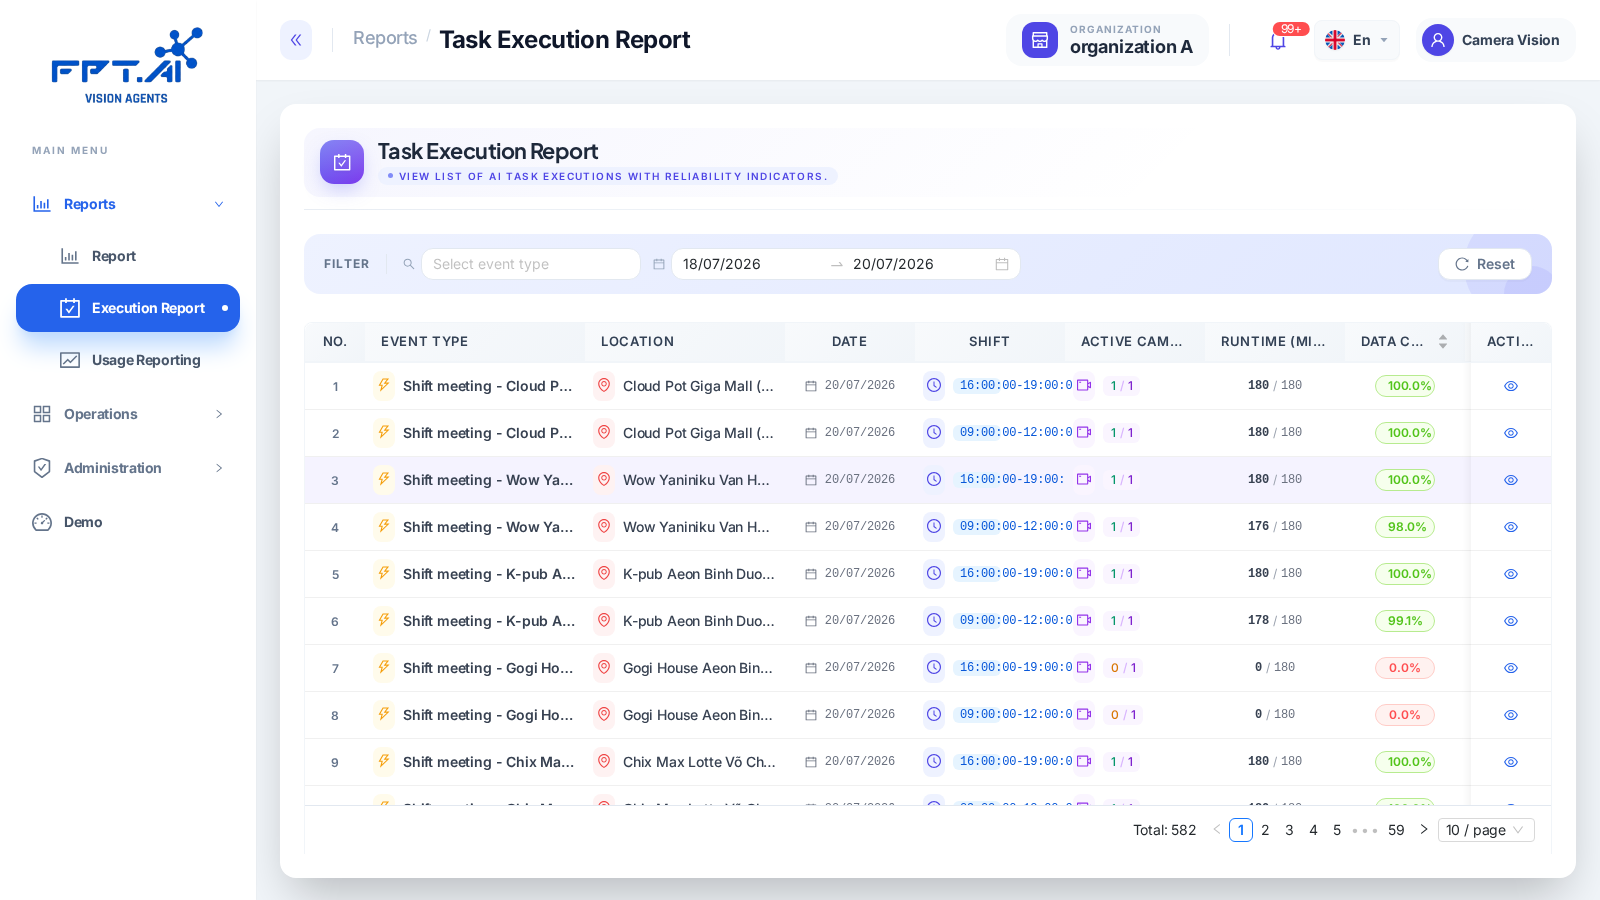
Go to Reports → Execution Report. The table shows: Event Type, Location, Date, Shift (time window), active/total cameras, actual/expected runtime (minutes), and a Data Completeness percentage — the lower it is, the more that shift's cameras under-recorded relative to expectations. There's a filter by Event Type and date range.
The Data Completeness metric here is similar to the Data Summary concept described in Configuring Task AI — same goal of spotting cameras with missing recordings, but presented as a per-shift summary report rather than grouped by task label.
Usage Reporting
The Usage Reporting page shows AI resource consumption (usage hours) by location — likely useful for cost/quota tracking.
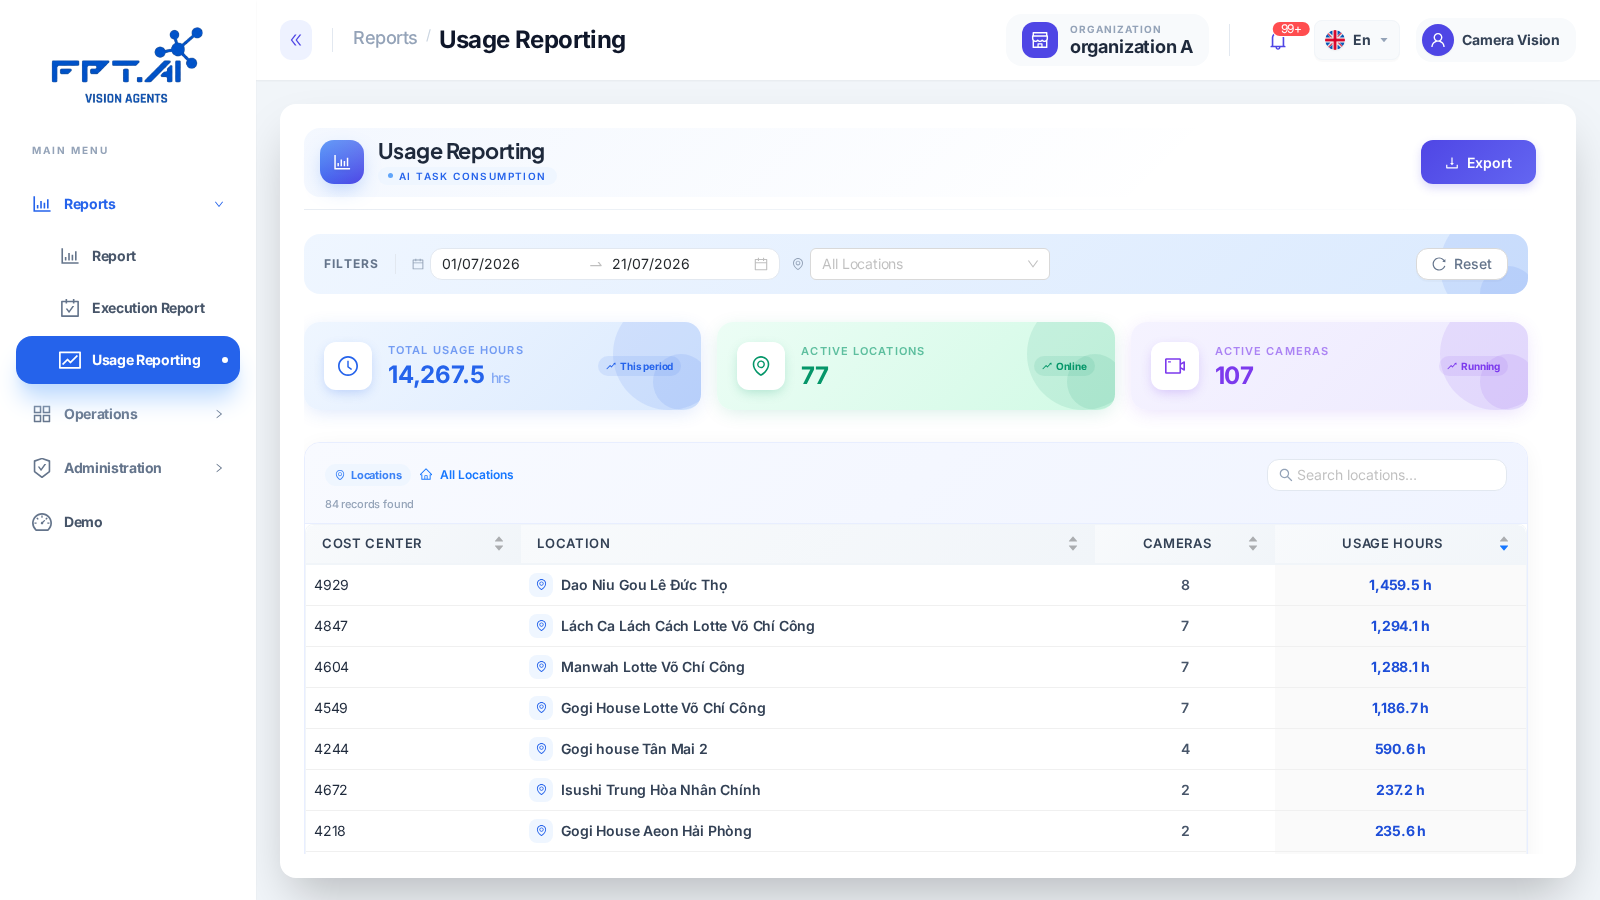
Go to Reports → Usage Reporting. The page shows:
- 3 summary metrics: Total Usage Hours (total usage hours in the period), Active Locations (number of active locations), Active Cameras (number of running cameras).
- A per-location detail table: Cost Center code, Location, number of Cameras, Usage Hours.
- Filters by date range and location; an Export button to export the data.